If there’s one thing J. Clark Archer knows – and knows well – it’s elections.
“I’ve been writing about elections for 35 years,” said Archer, professor of geography. “Before I became a geographer, my undergraduate degree was in political science, so I had a little bit of background from that.”
Archer’s “Historical Atlas of U.S. Presidential Elections, 1788-2004” was named Best Single-Volume Reference in Humanities & Social Sciences for 2006 by the Professional and Scholarly Publishing Division of the Association of American Publishers, and was on the Library Journal’s Best Reference List for 2006. His “Atlas of American Politics, 1960-2000” was named Choice Magazine’s Outstanding Academic Title for 2003 by the Association of College and Research Libraries.
“Elections are an empirical researcher’s dream because there’s just an enormous amount of data, and the data become available fairly frequently,” Archer said. “It’s not quite as data-driven as, let’s say, climatology. Election data tend to be obviously episodic – but there’s a lot of it.”
Archer’s latest publication, “Atlas of the 2012 Elections,” employs a geographical perspective to analyze virtually every aspect of the 2012 U.S. presidential election, in addition to selected state and local elections.
“I’ve been very interested in research that involves various kinds of quantitative methods and mapping,” Archer said. “So some of the tools and techniques that I learned as a graduate student and developed later on, in terms of analysis, are very applicable to the geography of elections.”
Archer and Robert H. Watrel, associate professor at South Dakota State University, produced most of the maps featured in the atlas, which is divided into nine chapters. Each chapter contains maps and accompanying narratives. Technical appendices describe the data sources along with cartographic and analytical procedures.
Of the atlas’ 40 contributors, six earned doctoral degrees in geography from UNL.
“If I knew that they knew something about the subject, then they had a higher chance of being invited to contribute,” Archer said.
The contributors provide a comprehensive and detailed assessment of many election issues and results including presidential primaries; newspaper endorsements and campaign stops; the results of the presidential election at regional and national levels; and key voting patterns by race and ethnicity, religion, occupational groups, age and poverty.
Moving beyond the national race, the atlas examines important senatorial and gubernatorial races and considers selected state referenda including the marijuana legalization votes in Colorado and Washington and same-sex marriage referenda in Maryland, Washington, Colorado and Minnesota. The voting patterns identified in 2012 elections are also compared to earlier contests to provide political and geographic context over time.
“These things fit together pretty nicely because there’s a lot of numerical data, a lot of locational and geographical patterns, and various kinds of statistics that can be applied to try and extract information,” Archer said.
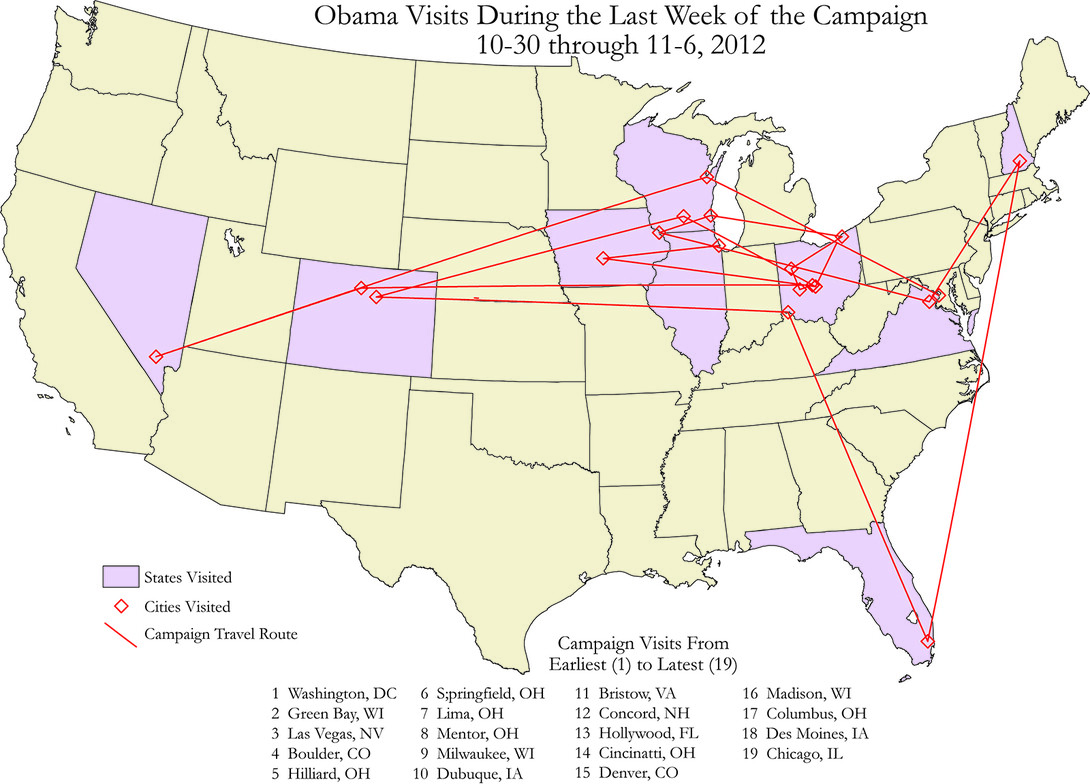
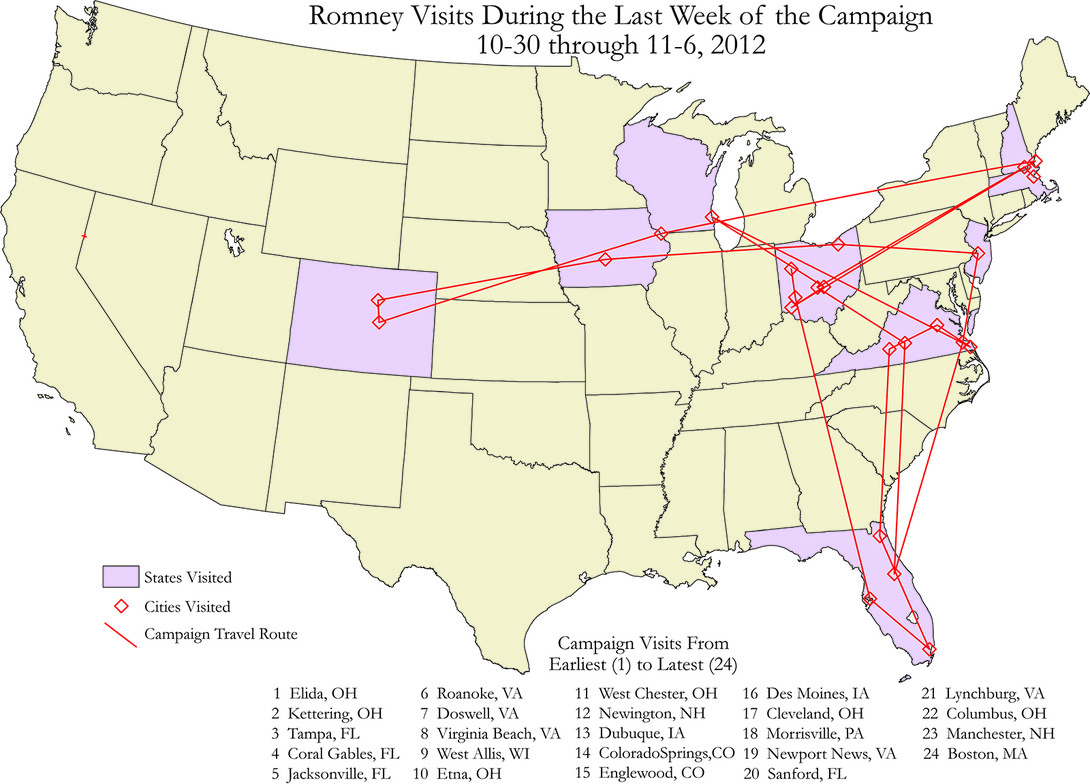
For instance, maps illustrating campaign stops of the presidential and vice-presidential candidates during the week leading up to Election Day indicate that key battleground states like Iowa, Florida and Ohio were fought over until the eleventh hour.
“Because an election is largely determined in states that could go one way or the other, states that are likely to be either very Republican or very Democratic – the candidates won’t visit them because they’re wasting resources,” Archer said. “The folks who guide these campaigns do some analyses that are somewhat similar to what we’ve done here. There seems to be a fair number of people who are interested in maps of elections.”
“Atlas of the 2012 Elections” is available for purchase from the Nebraska Maps and More Store in Hardin Hall. The book can also be purchased online and through Amazon.com. Phone orders are available at 402-472-3471.


