A new video series by the National Drought Mitigation Center at the University of Nebraska–Lincoln provides an audio-visual recap of weekly U.S. Drought Monitor updates.
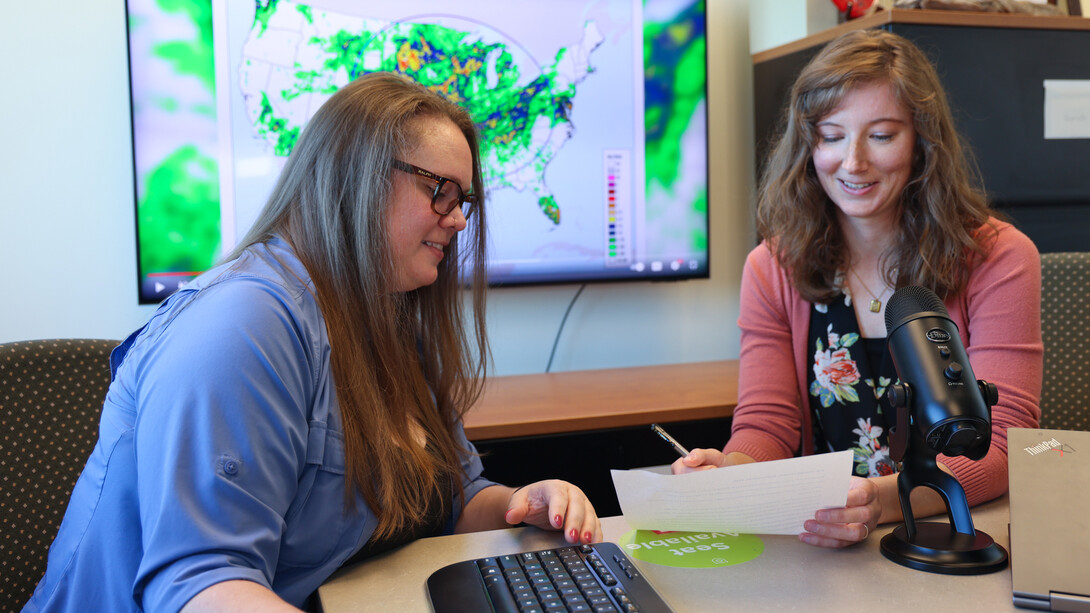
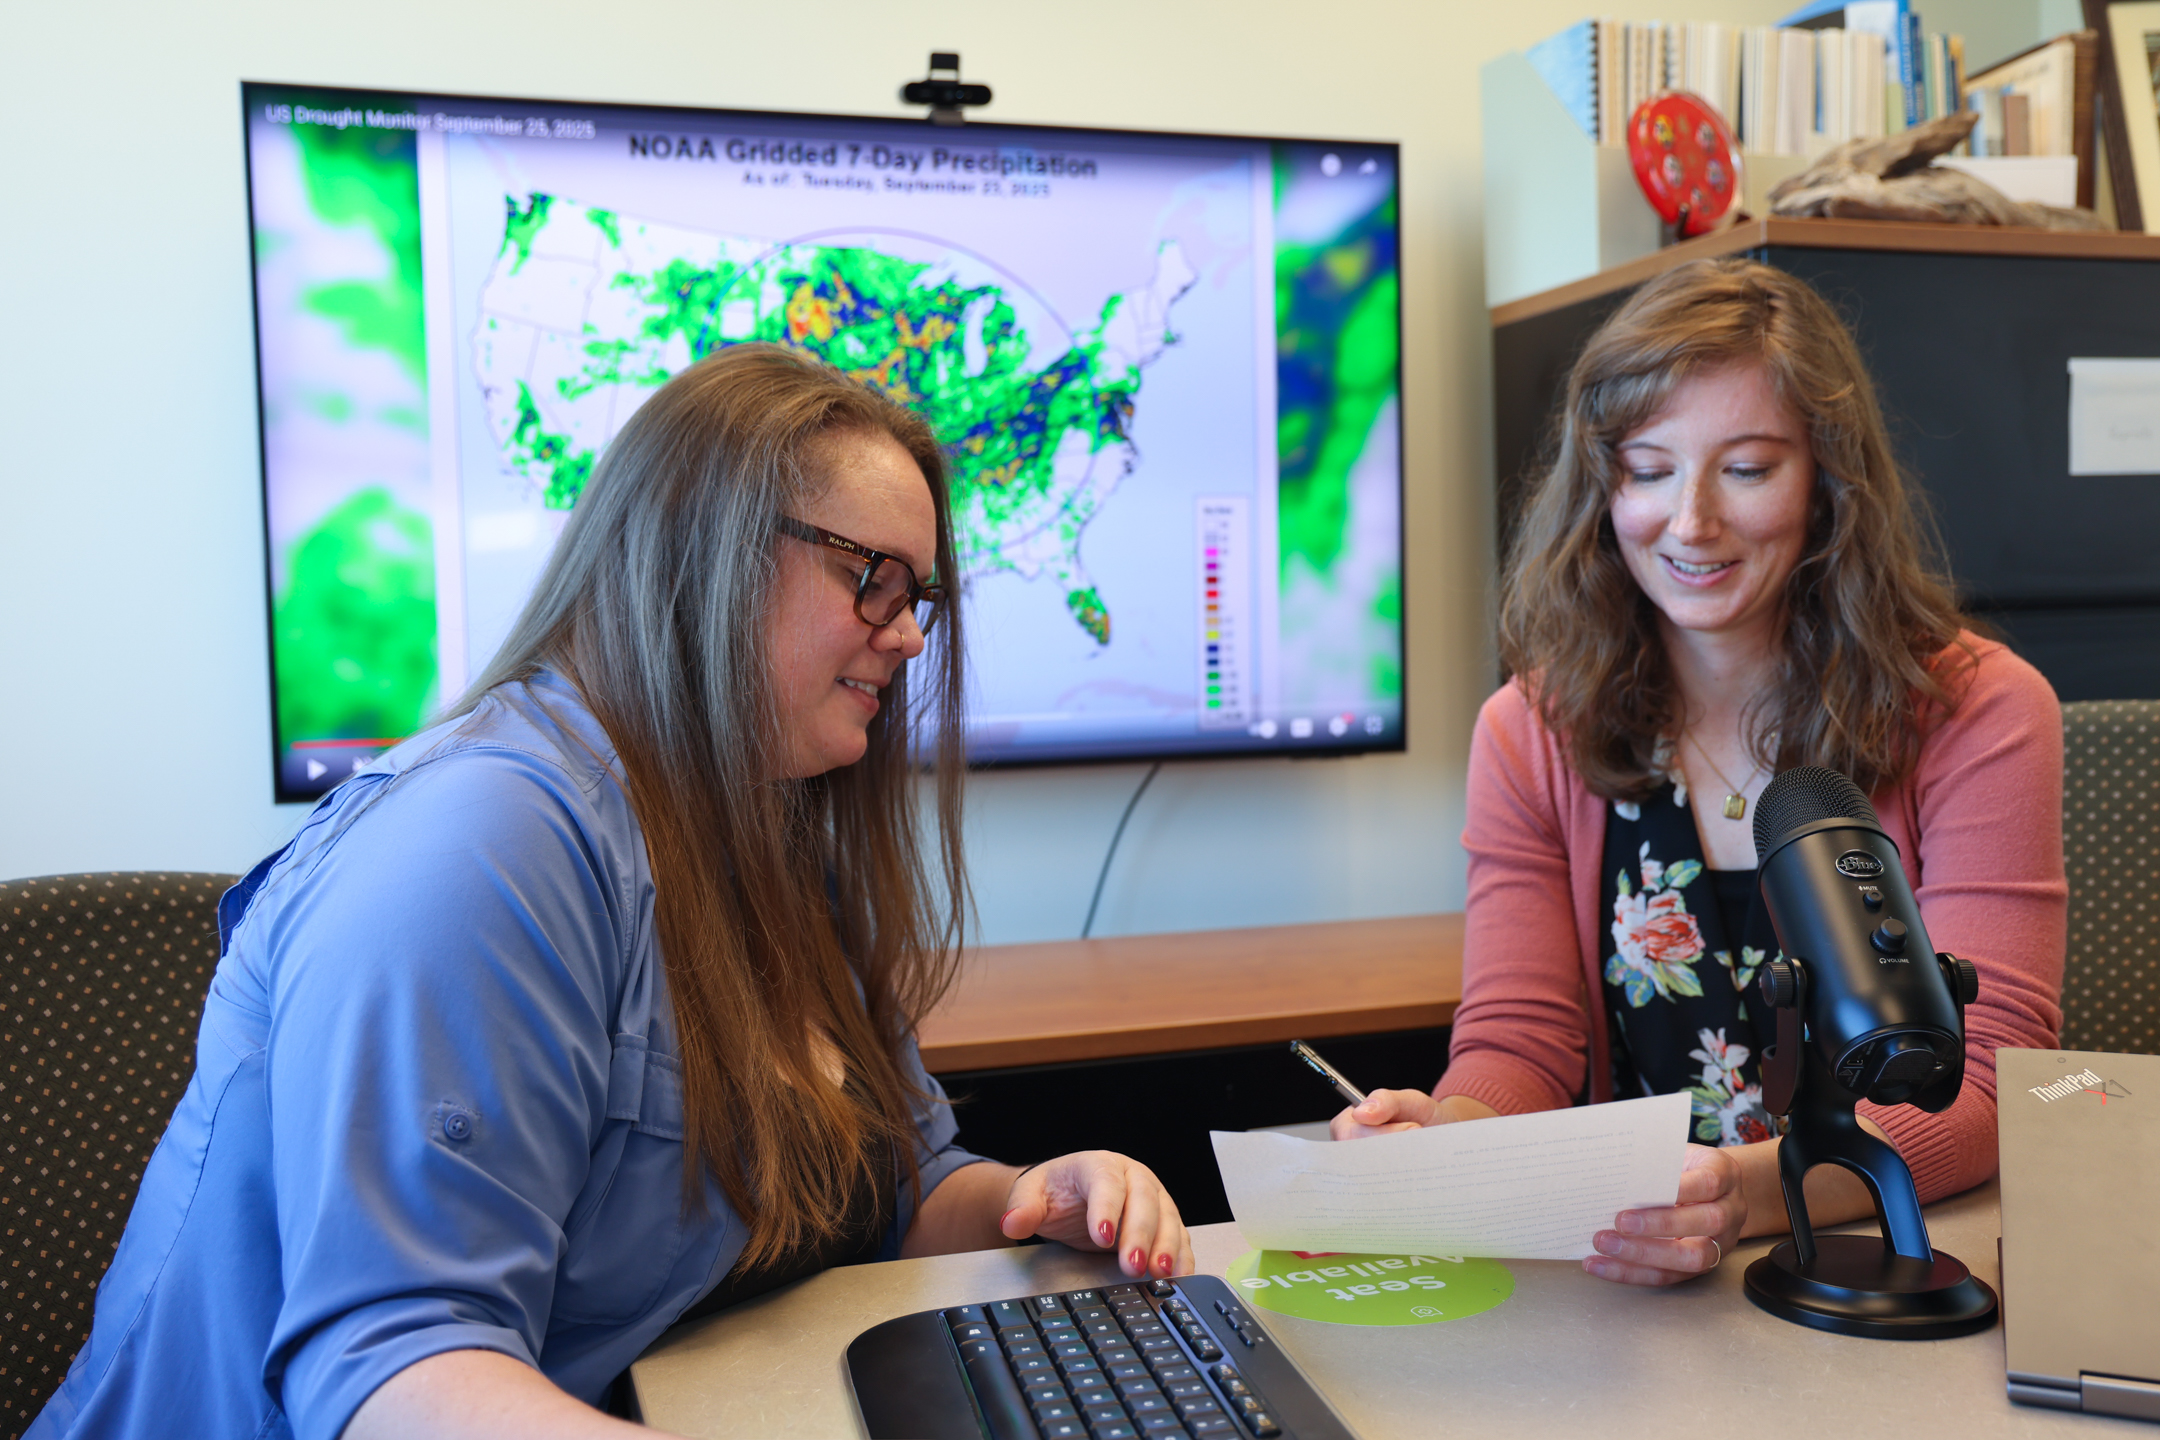
The “Drought Download” is released on Thursday afternoons through a collaborative effort among the center’s climatologists and communicators. The project leads are Lindsay Johnson, climatologist, and Emily Case-Buskirk, communications specialist.
“It’s more important than ever to provide timely, accurate and easily accessible information,” Johnson said. “The ‘Drought Download’ is especially valuable because it provides additional visuals to support the Drought Monitor.”
The monitor is produced each Thursday through a partnership between the drought center, the U.S. Department of Agriculture and the National Oceanic and Atmospheric Administration. It shows the location and severity of drought across the U.S. and its territories, ranging from normal conditions to exceptional drought.
As of the Sept. 25 Drought Monitor, 36.39% of the U.S. and Puerto Rico are in moderate drought or worse, an increase from 34.21% the week before. About 125.4 million Americans live in areas affected by drought.
Drought improved in Nebraska over the summer after the state was completely covered in abnormal dryness or drought in May. As of Sept. 18, Nebraska is 48.04% in abnormal dryness or drought, and 17.31% in moderate drought or worse.
The monitor triggers assistance through the Livestock Forage Disaster Program. Nebraska producers received $9.26 million in such payments from 2012 to 2024, exceeded only by Oklahoma, Texas and Kansas.
Each two-minute video includes an audio recording of the Drought Monitor summary, lightly edited for clarity. The narrative is written by the monitor’s author and describes how drought changed in the U.S. over the previous week. It shares context on how factors including precipitation, temperature and weather events affected drought. The videos also include the Drought Monitor map and a map showing how and where drought changed in the past week. It uses weather maps to illustrate information shared in the narrative.
“This video series is making the Drought Monitor accessible to a wider audience than ever before,” Case-Buskirk said. “We’re helping people connect the dots about where drought is occurring and what is contributing to it.”
Case-Buskirk, an award-winning podcaster, provides the voiceover each week.
For weekly updates, subscribe on YouTube or connect on Facebook.
Share
News Release Contact(s)
Related Links
Tags
High Resolution Photos
HIGH RESOLUTION PHOTOS